Real-time TDDFT
Overview
Real-time time-dependent density functional theory (RT-TDDFT) is a DFT-based approach to electronic excited states based on integrating the time-dependent Kohn-Sham (TDKS) equations in time. The theoretical underpinnings, strengths, and limitations are similar to traditional linear-response (LR) TDDFT methods, but instead of a frequency domain solution to the TDKS equations, RT-TDDFT yields a full time-resolved, potentially non-linear solution. Real-time simulations can be used to compute not only spectroscopic properties (e.g., absorption spectra, polarizabilites, etc), but also the time and space-resolved electronic response to arbitrary external stimuli (e.g., electron charge dynamics after laser excitation). For theoretical and computational details, please refer to the following paper:
- K. Lopata, N. Govind,”Modeling Fast Electron Dynamics with Real-Time Time-Dependent Density Functional Theory: Application to Small Molecules and Chromophores”, J. Chem. Theory Comput., 7, 1344 (2011) DOI:10.1021/ct200137z
This functionality is built on the Gaussian basis set DFT module, and will work for closed-shell (spin-restricted) and open-shell (spin unrestricted) calculations with essentially any combination of basis set and exchange-correlation functional in NWChem. The current implementation assumes frozen nuclei (Born-Oppenheimer approximation).
In a nutshell, running a RT-TDDFT calculation takes the following form:
- Compute ground state density matrix with DFT module
- Propagate density matrix using RT-TDDFT
- Post-process resulting time-dependent observables (e.g., dipole moment)
Units
Unless specified otherwise, all inputs and outputs are in atomic units. Some useful conversions are:
| Quantity | Conversion |
|---|---|
| Time | 1 au = 0.02419 fs |
| Length | 1 au = 0.5292 A |
| Energy | 1 au = 27.2114 eV |
| Electric field | 1 au = 514.2 V/nm |
| Dipole moment | 1 au = 2.542 D |
Syntax
The charge, geometry, basis
set, and
DFT options are
all specified as normal, using their respective syntax. Real-time TDDFT
parameters are supplied in the RT_TDDFT block (note, nothing is
case-sensitive), with all possible options summarized below, and each
discussed in detail
afterwards.
RT_TDDFT
  [TMAX <double default 1000>]
  [DT <double default 0.1>]
  [TAG <string default "<rt_tddft>: "]
  [LOAD (scf || vectors <string>)]
  [NCHECKS <integer default 10>]
  [NPRINTS (* || <integer>)]
  [NRESTARTS (* || <integer>)]
  [TOLERANCES (zero <double default 1e-8> || series <double default 1e-10> || interpol <double default 1e-7>)]
  [PROPAGATOR (euler || rk4 || magnus) default magnus]
  [EXP (diag || pseries)]
  [PROF]
  [NOPROP]
  [STATIC]
  [PRINT (*, dipole, quadrupole, field, moocc, field, energy, cputime, charge, convergence, s2)]
  [EXCITE <string geomname>` with <string fieldname>]
  [FIELD]
    ...
  [END]
  [VISUALIZATION]
    ...
  [END]
  [LOAD RESTART]
END
TMAX: Simulation time
This option specifies the maximum time (in au) to run the simulation before stopping, which must be a positive real number. In practice, you can just stop the simulation early, so in most cases it is simplest to just set this to a large value to ensure you capture all the important dynamics (see the example of resonant ultraviolet excitation of water). For most valence excitations, for example, 1000 au is overkill so you might want to automatically stop at 500 au:
rt_tddft
  ...
  tmax 500.0
  ...
end
DT: Time step
This specifies the electronic time step for time integration. A larger time step results in a faster simulation, but there are two issues which limit the size of the time step. First, the integration algorithm can become unstable and/or inaccurate for larger time steps, which depends on the integrator used. Very roughly speaking, the second order Magnus integrator should be reliable for time steps up to 0.2 au. Second, you must choose a time step small enough to capture the oscillations of interest, i.e., to resolve an excitation of energy ω, your time step needs to be smaller than π/ω, and typically a tenth of that for accuracy. For example, to capture high energy oscillations such as core-level excitations (e.g., ω = 50au) you might want a relative small time step:
rt_tddft
 ...
 dt 0.01
 ...
end
It is always good practice to check that your results are independent of time step.
TAG: Output label
This option sets a label for the output for convenient parsing (e.g.,
with “grep”). Every output line with time-dependent data will begin with
this string (set to <rt_tddft>: by default). For example setting:
rt_tddft
 ...
 tag "nameofrun"
 ...
end
will result in outputs that look like:
...
nameofrun      2.20000  -7.589146713114E+001     # Etot
...
NCHECKS: Number of run-time check points
This option takes an integer number (default 10), or * which means
every step, which sets the total of number of run-time checkpoints,
where various sanity checks are made such as symmetries, idempotency,
traces, etc. These checks are not terribly efficient (e.g., involve
re-building the TD Fock matrix) so excessive checking will slow down
execution.
rt_tddft
  ...
  nchecks 10
  ...
end
NPRINTS: Number of print points
This sets the number of print points, i.e., the total number of
time-dependent observables (e.g., dipole, charge, energy) that are
computed and printed. It either takes an integer number or * which
means every time step (this is the default). Since there is no
appreciable cost to computing and printing these quantities, there is
usually no need to change this from *.
rt_tddft
  ...
  nprints *
  ...
end
NRESTARTS: Number of restart checkpoints
This sets the number of run-time check points where the time-dependent complex density matrix is saved to file, allowing the simulation to be restarted) from that point. By default this is set to 0. There is no significant computational cost to restart checkpointing, but of course there is some disk I/O cost (which may become somewhat significant for larger systems). For example, in the following example there will be 100 restart points, which corresponds to 1 backup every 100 time steps.
rt_tddft
  ...
  tmax 1000.0
  dt 0.1
  nrestarts 100
  ...
end
TOLERANCES: Controlling numerical tolerances
This option controls various numerical tolerances:
zero: threshold for checks that quantities are zero, e.g., in symmetry checks (default 1e-8)series: numerical convergence for series, e.g., matrix exponentiation (default 1e-10)interpol: numerical convergence for interpolation, e.g., in Magnus propagator (default 1e-7)
Occasionally it is useful to loosen the interpolation tolerances if the Magnus interpolator requires an excessive amount of steps; usually this will not impact accuracy. For example, this sets the tolerances to their defaults with a looser interpolation tolerance:
rt_tddft
  ...
  tolerances zero 1d-8 series 1d-10 interpol 1e-5
end
PROPAGATOR: Selecting the integrator method
This selects the propagator (i.e., time integrator) method. Possible
choices include euler for Euler integration (terrible, you should
never use this), rk4 for 4th order Runge-Kutta, and magnus for 2nd
order Magnus with self-consistent interpolation. In virtually all cases
Magnus is superior in terms of stability. Euler or rk4 are perhaps only
useful for debugging or simplicity (e.g., for code development).
rt_tddft
  ...
  propagator magnus
  ...
end
EXP: Selecting the matrix exponentiation method
This selects the method for exponentiation matrices. For now this can
either be pseries for a contractive power series or diag for
diagonalization. In general the power series (default) is faster.
rt_tddft
  ...
  exp diag
  ...
end
PROF: Run-time profiling
This turns on run-time profiling, which will display time spent in each component of the code (e.g., building components of the TD Fock matrix, properites, etc). This slows code down slightly and results in very verbose output.
rt_tddft
  ...
  prof
  ...
end
NOPROP: Skipping propagation
This options causes the RT-TDDFT module skip propagation, i.e., to initialize and finalize. For now this is largely useful for skipping to visualization post-processing without having to re-run a simulation.
rt_tddft
  ...
  noprop
  ...
end
STATIC: Force static Fock matrix
This option sets the static Fock matrix flag, meaning the time-dependent
Fock matrix will not be recalculated at each time, but instead use the
t=0 value. This will drastically increase the simulation speed since the
bulk of the work is spent rebuilding the TD Fock matrix, but will give
non-physical results. For example, using static to compute an
absorption spectrum will result in excitations corresponding to the raw
eigenvalue differences without electron-hole relaxation. This option has
few uses besides dry-runs and debugging.
rt_tddft
  ...
  static
  ...
end
PRINT: Selecting time-dependent quantities to be printed
This sets the various time-dependent properties that are to be computed
and printed at each print point. Note that for many of these options,
the values are computed and printed for each geometry specified in the
input deck, not only the active one (i.e., the one set using set
geometry ... in the input deck). Possible choices are:
dipole: Dipole momentquadrupole: Quadrupole momentfield: External (applied) electric fieldmoocc: Molecular orbital occupationsenergy: Components of system energy (e.g., core, XC, total, etc)cputime: CPU time taken in simulation so far (useful for checking scaling)charge: Electronic charge (computed from density matrix, not from the XC grid)convergence: Convergence information (e.g., from Magnus)s2:value (openshell only) *: Print all quantities
The defaults correspond to:
rt_tddft
  ...
  print dipole field energy convergence
  ...
end
FIELD: Sub-block for specifying external electric fields
This sub-block is used to specify external electric fields, each of which must be given a unique name. Numerous fields can be specified, but each will applied to the system only if an appropriate excitation rule is set. There are a few preset field types; others would have to be manually coded. Note the names are arbitrary, but chosen here to be descriptive:
field "kick"
  type delta      # E(t=0) = max; E(t>0) = 0
  polarization x  # = x, y, z
  max 0.0001      # maximum value of electric field
  spin total      # = alpha, beta, total (only valid for open-shell)
end
field "gpulse"
  type gaussian   # Gaussian enveloped quasi-monochromatic pulse: E(t) = max * exp( -(t-t0)^2 / 2s^2) * sin(w0*t + phi0)
  polarization x  # = x, y, z
  frequency 0.12  # frequency of laser pulse in au (e.g., 0.12 au = 3.27 eV)
  phase 0.0       # phase shift of laser pulse (in rad)
  center 200.0    # center of Gaussian envelope (in au time)
  width 50.0      # width of Gaussian pulse (in au time)
  max 0.0001      # maximum value of electric field
  spin total      # = alpha, beta, total (only valid for open-shell)
end
field "hpulse"
  type hann       # sin^2 (Hann) enveloped quasi-monochromatic pulse
  polarization x  # = x, y, z
  frequency 0.12  # frequency of laser pulse in au (e.g., 0.12 au = 3.27 eV)
  center 200.0    # center of Hann envelope (in au time)
  width 50.0      # width of Hann pulse (in au time)
  max 0.0001      # maximum value of electric field
  spin total      # = alpha, beta, total (only valid for open-shell)
end
field "resonant"
  type cw         # monochromatic continuous wave
  frequency 0.12  # frequency of laser pulse in au (e.g., 0.12 au = 3.27 eV)
  polarization x  # = x, y, z
  max 0.0001      # maximum value of electric field
  spin total      # = alpha, beta, total (only valid for open-shell)
end
EXCITE: Excitation rules
This sets the rules for applying external fields to the system. It takes
the form excite <geom> with <field>, where <geom> is the name of a
geometry fragment (defaults to “geometry” which is the default geometry
name), and <field> is the name of a field
structure.
Assuming, for example, you have defined a field name kick this option
takes the form (note that quotes are optional and shown for clarity):
rt_tddft
  ...
  excite "geometry" with "kick"
  ...
end
VISUALIZATION: Sub-block for controlling 3D visualization
This block is used to control visualization of the electronic charge
density, which is typically used during a resonant excitation. This is a
two stage process. During the propagation, a series of density matrices
will be dumped to file (see options below). After propagation, if the
dplot option is set, the code will read in options from a separate
DPLOT block and convert the density matrix snapshots to a corresponding
series of real-space charge density cube
files.
visualization
  tstart 0.0        # start visualization at this time
  tend 100.0        # stop visualization at this time
  treference 0.0    # subtract density matrix at this time (useful for difference densities)
  dplot             # post-process density matrices into cube files after propagation
end
LOAD RESTART
This keyword needs to be added to restart a calculation. In the following example, the calculation will restart from the previous calculation and extend the run to the new tmax
rt_tddft
  ...
  tmax 10.0        # new end time
  load restart
end
MOCAP: Sub-block for molecular orbital complex absorbing potential
The K. Lopata and N. Govind, “Near and Above Ionization Electronic Excitations with Non-Hermitian Real-Time Time-Dependent Density Functional Theory”, Journal of Chemical Theory and Computation 9 (11), 4939-4946 (2013) DOI:10.1021/ct400569s
  mocap
    maxval 100.0     # clamp CAP at this value (in Ha)
    emin 0.5         # any MO with eigenvalue >= 0.5 Ha will have CAP applied to it
    prefac 1.0       # prefactor for exponential
    expconst 1.0     # exponential constant for CAP
    on               # turn on/off CAP
    nochecks         # disable checks for speed
    noprint          # don't print CAP value
  end
MAXVAL: Exponential Maximum Value
EMIN: Vacuum Energy Level
ON/OFF: Turn on/off CAP
The default value is off, i.e. no complex absorbing potential is applied.
Worked Examples
Absorption spectrum of water
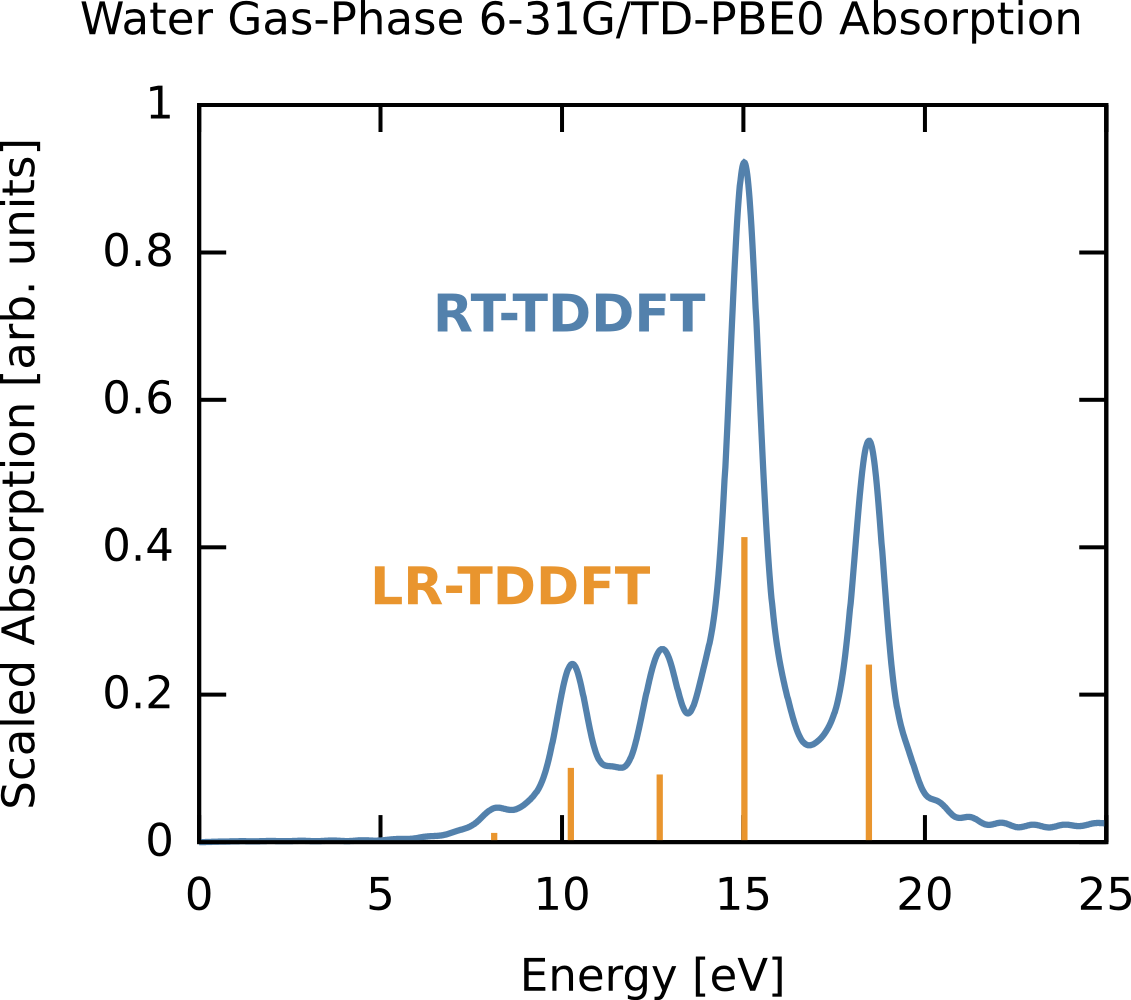
Here, we compute the 6-31G/TD-PBE0 absorption spectrum of gas-phase water using RT-TDDFT. In the weak-field limit, these results are essentially identical to those obtained via traditional linear-response TDDFT. Although it involves significantly more work do use RT-TDDFT in this case, for very large systems with many roots a real-time approach becomes advantageous computationally and also does not suffer from algorithm stability issues.
To compute the absorption, we find the ground state of the system and then subject it to three delta-function excitations (x,y,z), which simultaneously excites all electronic modes of that polarization. The three resulting dipole moments are then Fourier transformed to give the frequency-dependent linear polarizability, and thus the absorption spectrum. The full input deck is RT_TDDFT_h2o_abs.nw and the corresponding output is RT_TDDFT_h2o_abs.nwo.gz.
title "Water TD-PBE0 absorption spectrum"
echo


start water

##
## aug-cc-pvtz / pbe0 optimized
##
## Note: you are required to explicitly name the geometry
##
geometry "system" units angstroms nocenter noautoz noautosym
  O     0.00000000    -0.00001441    -0.34824012
  H    -0.00000000     0.76001092    -0.93285191
  H     0.00000000    -0.75999650    -0.93290797
end

## Note: We need to explicitly set the "active" geometry even though there is only one geom.
set geometry "system"

## All DFT and basis parameters are inherited by the RT-TDDFT code
basis
 * library 6-31G
end

dft
  xc pbe0
end

## Compute ground state of the system
task dft energy

##
## Now, we compute an x, y, and z kick simulation, which we give separate "tags" for post-processing.
##

unset rt_tddft:*
rt_tddft
  tmax 200.0
  dt 0.2

  tag "kick_x"

  field "kick"
    type delta
    polarization x
    max 0.0001
  end

  excite "system" with "kick"
 end
task dft rt_tddft

unset rt_tddft:*
rt_tddft
  tmax 200.0
  dt 0.2

  tag "kick_y"

  field "kick"
    type delta
    polarization y
    max 0.0001
  end

  excite "system" with "kick"
 end
task dft rt_tddft

unset rt_tddft:*
rt_tddft
  tmax 200.0
  dt 0.2

  tag "kick_z"

  field "kick"
    type delta
    polarization z
    max 0.0001
  end

  excite "system" with "kick"
 end
task dft rt_tddft
After running the simulation, we extract the x-dipole moment for the x-kick and similarly for the y and z-kicks (see “contrib/parsers” directory for this script or download here: RT_TDDFT_scripts.tgz ).
nw_rtparse.py -xdipole -px -tkick_x h2o_abs.nwo > x.dat
nw_rtparse.py -xdipole -py -tkick_y h2o_abs.nwo > y.dat
nw_rtparse.py -xdipole -pz -tkick_z h2o_abs.nwo > z.dat
Note, the syntax for extracting the x polarization for the x-kick, etc. Alternatively, we could grep and cut, or whatnot. This will give use the resulting time-dependent dipole moments:

Now, we need to take the Fourier transforms of these dipole moments to yield the the x,x element of the 3x3 linear polarizability tensor, and similarly for the y,y and z,z elements. Here I am using an FFT utility, although any discrete Fourier transform will do. To accelerate convergence of the FFT, I have damped the time signals by exp(-t /τ) which results in Lorentzians with FWHM of 2 / τ and have also “zero padded” the data with 50000 points. This is not critical for extracting frequencies, but creates “cleaner” spectra, although care must be taken to damp sufficiently if padding to avoid artifacts (see small ripples around 23 eV in plot below). After Fourier transform, I “paste” the three files together to easily plot the absorption, which is constructed from the trace of the polarizability matrix, i.e., the sum of the imaginary parts of the FFTs of the dipole moments.
S (ω) = (4πω)/(3cκ)Tr[Im α(ω)]
where c is the speed of light (137 in atomic units), κ is the kick electric field strength, and α(ω) is the linear polarizabilty tensor computed from the Fourier transforms of the time-dependent dipole moments. For example,
fft1d -d50 -z -p50000 < x.dat | rotate_fft > xw.dat
fft1d -d50 -z -p50000 < y.dat | rotate_fft > yw.dat
fft1d -d50 -z -p50000 < z.dat | rotate_fft > zw.dat
paste xw.dat yw.dat zw.day > s.dat
Here, you can just use your favorite Fourier transform utility or analysis software, but for convenience there is also a simple GNU Octave fft1d.m utility in the “contrib/parsers” directory of the trunk or download here: RT_TDDFT_scripts.tgz Note, options are hardcoded at the moment, so the switches above are not correct instead edit the file and run (also it reads file rather than redirect from stdin). Assuming the FFT output takes the form (w, Re, Im, Abs), to plot using gnuplot we would do:
gnuplot> plot "s.dat" u ($1*27.2114):($1*($3+$7+$11))
where we have scaled by 27.2114 to output in eV instead of atomic units, and we have not properly scaled to get the absolute oscillator strengths (thus our magnitudes are in “arbitrary units”). The real-time spectrum is shown below, along with the corresponding linear-response TDDFT excitations are shown in orange for comparison. Since we are in the weak field regime, the two are identical. Note the oscillator strengths are arbitrary and scaled, if not scaled the area under each RT-TDDFT curve should integrate to the linear response oscillator strength.
Resonant ultraviolet excitation of water
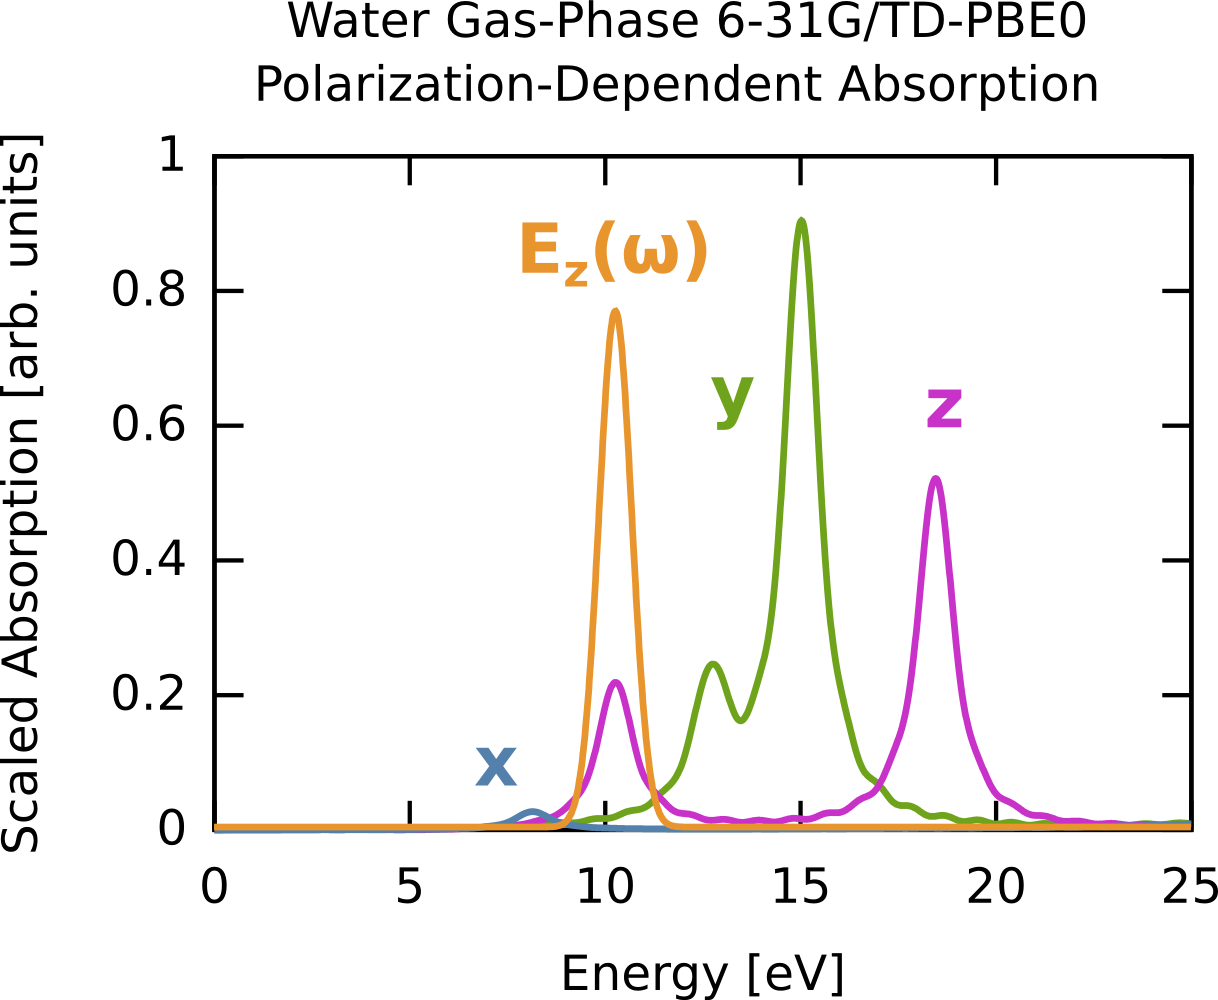
In this example we compute the time-dependent electron response to a quasi-monochromatic laser pulse tuned to a particular transition. We will use the results of the previous example (6-31G/PBE0 gas-phase water). First, we consider the absorption spectrum (computed previously) but plotted for the three polarizations (x,y,z) rather then as a sum. Say we are interested in the excitation near 10 eV. We can clearly see this is a z-polarized transition (green on curve). To selectively excite this we could use a continuous wave E-field, which has a delta-function, i.e., single frequency, bandwidth but since we are doing finite simulations we need a suitable envelope. The broader the envelope in time the narrower the excitation in frequency domain, but of course long simulations become costly so we need to put some thought into the choice of our envelope. In this case the peak of interest is spectrally isolated from other z-polarized peaks, so this is quite straightforward. The procedure is outlined below, and the corresponding frequency extent of the pulse is shown on the absorption figure in orange. Note that it only covers one excitation, i.e., the field selectively excites one mode. The full input deck is RT_TDDFT_h2o_resonant.nw and the output is RT_TDDFT_h2o_resonant.nwo.gz.
title "Water TD-PBE0 resonant excitation"
echo
scratch_dir ./scratch
permanent_dir ./perm

start water

##
## aug-cc-pvtz / pbe0 optimized
##
## Note: you are required to explicitly name the geometry
##
geometry "system" units angstroms nocenter noautoz noautosym
  O     0.00000000    -0.00001441    -0.34824012
  H    -0.00000000     0.76001092    -0.93285191
  H     0.00000000    -0.75999650    -0.93290797
end

## Note: We need to explicitly set the "active" geometry even though there is only one geom.
set geometry "system"

## All DFT and basis parameters are inherited by the RT-TDDFT code
basis
 * library 6-31G
end

dft
 xc pbe0
end

## Compute ground state of the system
task dft energy

##
## We excite the system with a quasi-monochromatic
## (Gaussian-enveloped) z-polarized E-field tuned to a transition at
## 10.25 eV.  The envelope takes the form:
##
## G(t) = exp(-(t-t0)^2 / 2s^2)
##
## The target excitation has an energy (frequency) of w = 0.3768 au
## and thus an oscillation period of T = 2 pi / w = 16.68 au
##
## Since we are doing a Gaussian envelope in time, we will get a
## Gaussian envelope in frequency (Gaussians are eigenfunctions of a
## Fourier transform), with width equal to the inverse of the width in
## time.  Say, we want a Gaussian in frequency with FWHM = 1 eV
## (recall FWHM = 2 sqrt (2ln2) s_freq) we want an s_freq = 0.42 eV =
## 0.0154 au, thus in time we need s_time = 1 / s_time = 64.8 au.
##
## Now we want the envelope to be effectively zero at t=0, say 1e-8
## (otherwise we get "windowing" effects).  Reordering G(t):
##
## t0 = t - sqrt(-2 s^2 ln G(t))
##
## That means our Gaussian needs to be centered at t0 = 393.3 au.
##
## The total simulation time will be 1000 au to leave lots of time to
## see oscillations after the field has passed.
##
rt_tddft
  tmax 1000.0
  dt 0.2

  field "driver"
    type gaussian
    polarization z
    frequency 0.3768  # = 10.25 eV
    center 393.3
    width 64.8
    max 0.0001
  end

  excite "system" with "driver"
 end
task dft rt_tddft
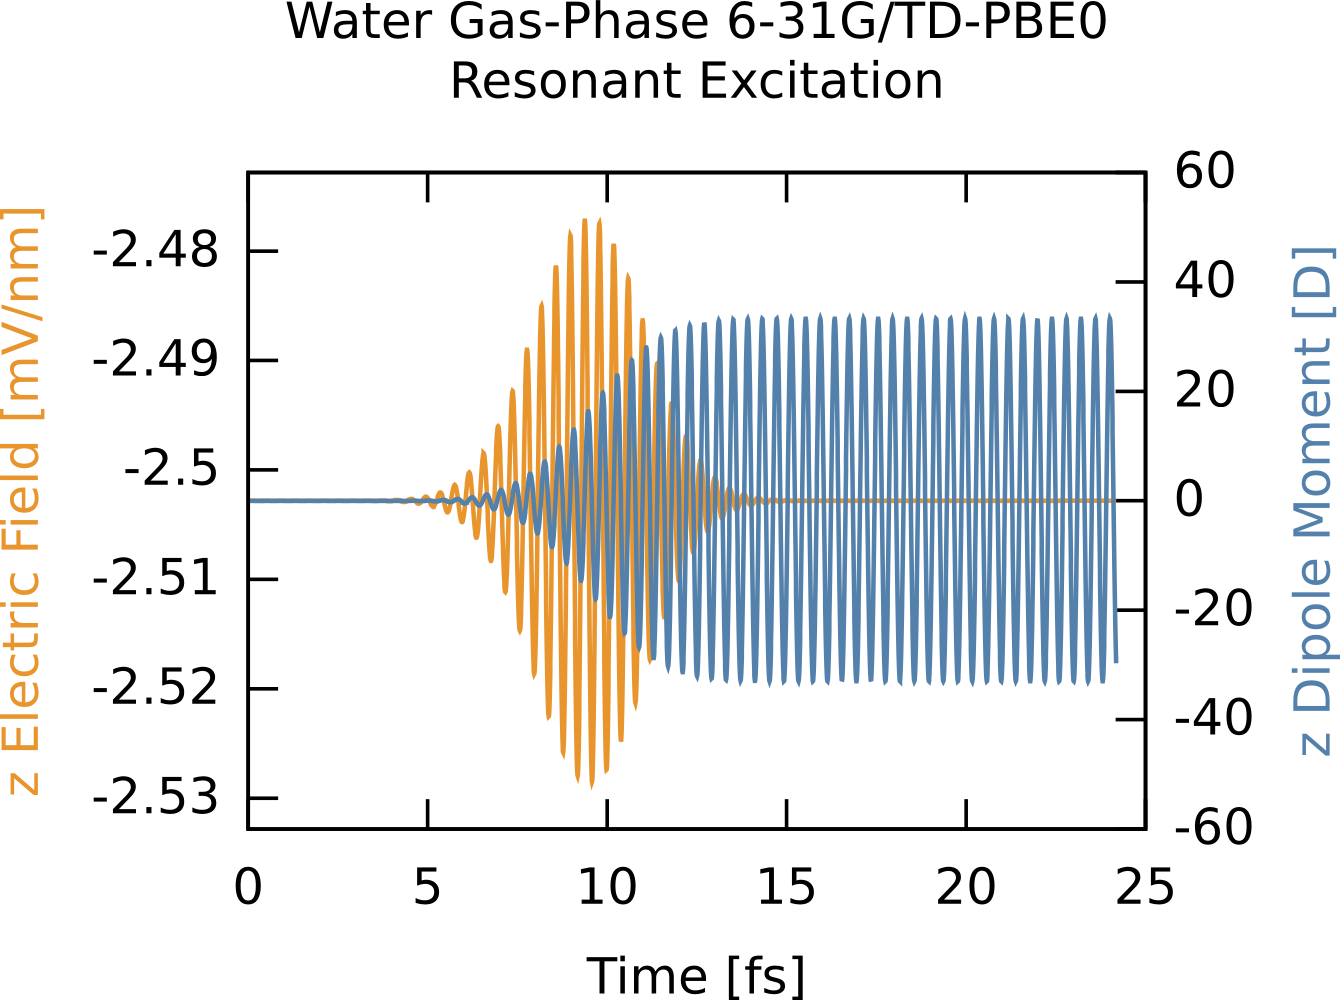
From the time-dependent dipole moment you can see the field driving the system into a superposition of the ground state and the one excited state, which manifests as monochromatic oscillations. After the field has passed the dipole oscillations continue forever as there is no damping in the system.
Charge transfer between a TCNE dimer
Here we compute the time-dependent charge oscillations between a TCNE (tetracyanoethylene) dimer separated by 3 Angstroms, where the top molecule starts neutral and the bottom one starts with a -1 charge. This somewhat non-physical starting point will lead to far-from-equilibrium dynamics as the charge violently sloshes between the two molecules, with the oscillation period a function of the molecular separation. The trick here is to use fragments by have multiple geometries in the input deck, where each fragment is converged separately, then assembled together without SCF to use as a starting point. We use a small but diffuse basis and a range-separated functional (CAM-B3LYP). The input deck is RT_TDDFT_tcne_dimer.nw and the full output is RT_TDDFT_tcne_dimer.nwo.gz.
title "Tetracyanoethylene dimer charge transfer"

echo
scratch_dir ./scratch
permanent_dir ./perm

start tcne
echo

##
## Each fragment optimized with cc-pvdz/B3LYP
##
geometry "bottom" units angstroms noautosym nocenter noautoz
 C    -1.77576486     0.66496556     0.00004199
 N    -2.94676621     0.71379797     0.00004388
 C    -0.36046718     0.62491168     0.00003506
 C     0.36049301    -0.62492429    -0.00004895
 C     1.77579907    -0.66504145    -0.00006082
 N     2.94680364    -0.71382258    -0.00006592
 C    -0.31262746    -1.87038951    -0.00011201
 N    -0.85519492    -2.90926164    -0.00016331
 C     0.31276207     1.87031662     0.00010870
 N     0.85498782     2.90938919     0.00016857
end

geometry "top" units angstroms noautosym nocenter noautoz
 C    -1.77576486     0.66496556     3.00004199
 N    -2.94676621     0.71379797     3.00004388
 C    -0.36046718     0.62491168     3.00003506
 C     0.36049301    -0.62492429     2.99995105
 C     1.77579907    -0.66504145     2.99993918
 N     2.94680364    -0.71382258     2.99993408
 C    -0.31262746    -1.87038951     2.99988799
 N    -0.85519492    -2.90926164     2.99983669
 C     0.31276207     1.87031662     3.00010870
 N     0.85498782     2.90938919     3.00016857
end


## dimer geometry is the union of bottom and top geometry
geometry "dimer" units angstroms noautosym nocenter noautoz
 C    -1.77576486     0.66496556     0.00004199
 N    -2.94676621     0.71379797     0.00004388
 C    -0.36046718     0.62491168     0.00003506
 C     0.36049301    -0.62492429    -0.00004895
 C     1.77579907    -0.66504145    -0.00006082
 N     2.94680364    -0.71382258    -0.00006592
 C    -0.31262746    -1.87038951    -0.00011201
 N    -0.85519492    -2.90926164    -0.00016331
 C     0.31276207     1.87031662     0.00010870
 N     0.85498782     2.90938919     0.00016857
#---
 C    -1.77576486     0.66496556     3.00004199
 N    -2.94676621     0.71379797     3.00004388
 C    -0.36046718     0.62491168     3.00003506
 C     0.36049301    -0.62492429     2.99995105
 C     1.77579907    -0.66504145     2.99993918
 N     2.94680364    -0.71382258     2.99993408
 C    -0.31262746    -1.87038951     2.99988799
 N    -0.85519492    -2.90926164     2.99983669
 C     0.31276207     1.87031662     3.00010870
 N     0.85498782     2.90938919     3.00016857
end


##
## C, N: 3-21++G
##
basis spherical
C    S
    172.2560000              0.0617669
     25.9109000              0.3587940
      5.5333500              0.7007130
C    SP
      3.6649800             -0.3958970              0.2364600
      0.7705450              1.2158400              0.8606190
C    SP
      0.1958570              1.0000000              1.0000000
C    SP
      0.0438000              1.0000000              1.0000000
N    S
    242.7660000              0.0598657
     36.4851000              0.3529550
      7.8144900              0.7065130
N    SP
      5.4252200             -0.4133010              0.2379720
      1.1491500              1.2244200              0.8589530
N    SP
      0.2832050              1.0000000              1.0000000
N    SP
      0.0639000              1.0000000              1.0000000
end


##
## Charge density fitting basis.
##
basis "cd basis"
C    S
      5.91553927E+02         0.31582020
      1.72117940E+02         0.87503863
      5.47992590E+01         2.30760524
C    S
      1.89590940E+01         1.0000000
C    S
      7.05993000E+00         1.0000000
C    S
      2.79484900E+00         1.0000000
C    S
      1.15863400E+00         1.0000000
C    S
      4.94324000E-01         1.0000000
C    S
      2.12969000E-01         1.0000000
C    P
      3.27847358E-01         1.0000000
C    P
      7.86833659E-01         1.0000000
C    P
      1.97101832E+00         1.0000000
C    D
      4.01330100E+00         1.0000000
C    D
      1.24750500E+00         1.0000000
C    D
      4.08148000E-01         1.0000000
C    F
      9.00000000E-01         1.0000000
N    S
      7.91076935E+02         0.41567506
      2.29450184E+02         1.14750694
      7.28869600E+01         3.01935767
N    S
      2.51815960E+01         1.0000000
N    S
      9.37169700E+00         1.0000000
N    S
      3.71065500E+00         1.0000000
N    S
      1.53946300E+00         1.0000000
N    S
      6.57553000E-01         1.0000000
N    S
      2.83654000E-01         1.0000000
N    P
      4.70739194E-01         1.0000000
N    P
      1.12977407E+00         1.0000000
N    P
      2.83008403E+00         1.0000000
N    D
      5.83298650E+00         1.0000000
N    D
      1.73268650E+00         1.0000000
N    D
      5.45242500E-01         1.0000000
N    F
      1.82648000E+00         1.0000000
end


##
## Universal DFT parameters. Note, we are doing open-shell even for
## the neutral fragment so the movecs have the correct size.
##
## We are using the CAM-B3LYP functional (no need to use "direct"
## since we are doing CD fitting).
##
dft
  xc xcamb88 1.00 lyp 0.81 vwn_5 0.19 hfexch 1.00
  cam 0.33 cam_alpha 0.19 cam_beta 0.46
  odft
  convergence density 1d-9
  grid fine
  maxiter 1000
end


##
## Converge bottom fragment with extra electron and top fragment as
## neutral.
##
charge -1
set geometry "bottom"
dft
  mult 2
  vectors input atomic output "bottom.movecs"
end
task dft energy

charge 0
set geometry "top"
dft
  mult 1
  vectors input atomic output "top.movecs"
end
task dft energy


##
## Assemble the two fragments but don't do SCF--this keeps the system
## in a far-from-equilibrium state from which we will watch the
## dynamics.
##
charge -1
set geometry "dimer"
dft
  mult 2
  vectors input fragment "bottom.movecs" "top.movecs" output "dimer.movecs"
  noscf
end
task dft energy


##
## Now do RT-TDDFT from this crazy state without any electric fields.
##
rt_tddft
  tmax 500.0
  dt 0.2
  load vectors "dimer.movecs"

  print dipole field energy s2 charge
end
task dft rt_tddft
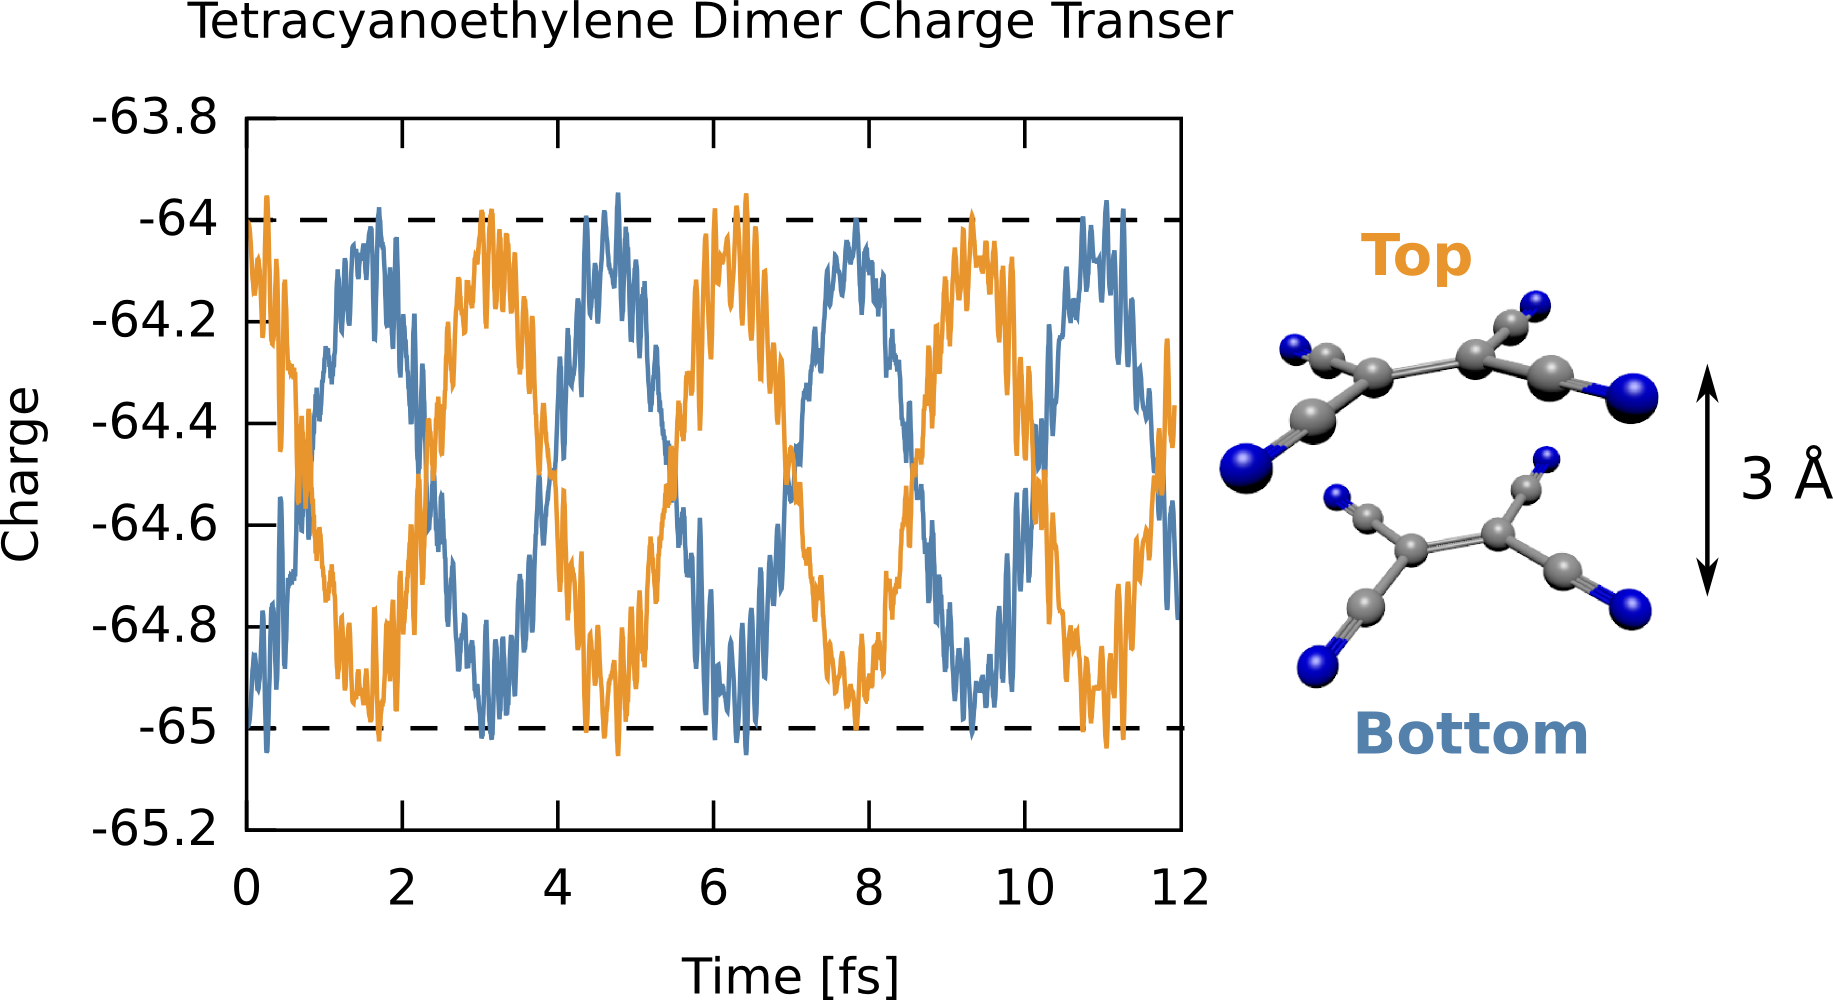
The time-dependent charge shows that the excess electron starts on the “bottom” molecule (i.e., a total electronic charge of -65), then swings to completely occupy the “top” molecule then oscillates back and forth. The frequency of this oscillation is dependent on the separation, with larger separations leading to lower frequencies. It is important to note, however, this starting point is highly non-physical, specifically converging the two fragments together and “gluing” them together introduces an indeterminate amount of energy to the system, but this simulation shows how charge dynamics simulations can be done.
MO CAP example
## aug-cc-pvtz/PBE0 optimized
geometry "system" units angstroms noautosym noautoz nocenter
  O     0.00000043     0.11188833     0.00000000
  H     0.76000350    -0.47275229     0.00000000
  H    -0.76000393    -0.47275063     0.00000000
end

set geometry "system"

basis spherical
  * library 6-31G*
end

dft
  xc pbe0
  convergence density 1d-9
end
task dft

rt_tddft
  dt 0.2
  tmax 250.0

  print dipole field energy charge

  mocap
    expconst 1.0     # exponential constant for CAP
    emin 0.5         # any MO with eigenvalue >= 0.5 Ha will have CAP applied to it
    prefac 1.0       # prefactor for exponential
    maxval 100.0     # clamp CAP at this value (in Ha)
    on               # turn on CAP
    nochecks         # disable checks for speed
    noprint          # don't print CAP value
  end

  field "kick"
    type delta
    max 0.0001
    polarization z
  end

  excite "system" with "kick"
end
task dft rt_tddft
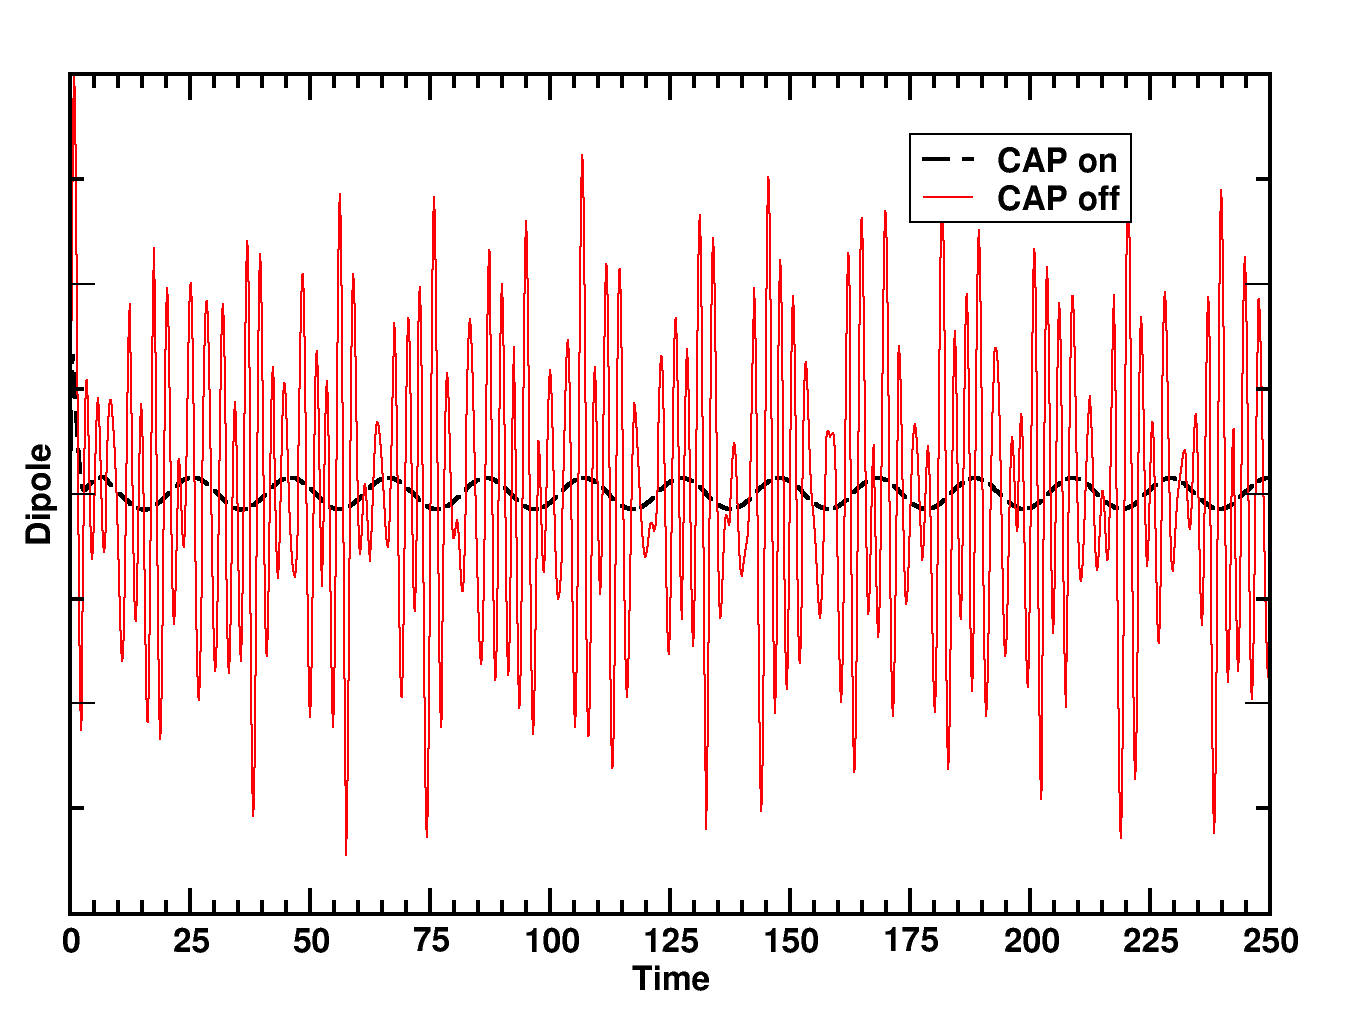
After running the parser script on the output files from the input above using either with the on or off keywords, the following plot can be produced from the data file obtained with the command nw_rtparse.py -xdipole -pz -t"<rt_tddft>"
